Here under are some articles talking about Building a Plug-In Architecture Using C#
Monday, 28 February 2011
Merging .NET assemblies using ILMerge
Merging .NET assemblies using ILMerge
Introduction
As you know, traditional linking of object code is no longer necessary in .NET. A .NET program will usually consist of multiple parts. A typical .NET application consists of an executable assembly, a few assemblies in the program directory, and a few assemblies in the global assembly cache. When the program is run, the runtime combines all these parts to a program. Linking at compile time is no longer necessary.
But sometimes, it is nevertheless useful to combine all parts a program needs to execute into a single assembly. For example, you might want to simplify the deployment of your application by combining the program, all required libraries, and all resources, into a single .exe file.
A single project
If all parts of your program are written by yourself in the same language, you can obviously just add all source files to a single project. The result will be a single DLL or EXE containing all dependencies.
csc /target:winexe /out:Program.exe
     MainProgram.cs ClassLibrary1.cs ClassLibrary2.cs
However, if your program is written in multiple languages or if you are using binary third party libraries, you are out of luck.
.NET Modules
The .NET compilers already contain options for exactly this. If you compile a project, there is an option to create a module, which is similar to an assembly but without a manifest file. You can then use the al.exe tool to combine some of these modules to a single assembly. This feature makes it possible to create a single assembly that contains multiple languages.
First, you would compile the program and the class libraries to netmodules using the module target. Then you can use the assembly linker al.exe to combine these modules to a single assembly.
csc /target:module /out:ClassLibrary1.netmodule ClassLibrary1.cs
vbc /target:module /out:ClassLibrary2.netmodule ClassLibrary2.vb
vbc /target:module /out:Program.netmodule Program.vb
al /target:winexe /out:Program.exe ClassLibrary1.netmodule
                ClassLibrary2.netmodule Program.netmodule
But unfortunately, this method only works if you have all the required parts of your program either as source code or as .NET modules. If you are useing a third party class library in assembly form, you are again out of luck.
ILMerge
Since a .NET module is basically just an assembly without an assembly manifest, it should be possible to convert an assembly to a .NET module, at least that is what I thought. When researching this on Google, I found a tremendously useful tool on Microsoft research called ILMerge. This little gem makes it possible to link multiple assemblies to a single one.
First, you would compile your libraries to DLLs and your program to an EXE referencing the DLLs. This is exactly what Visual Studio would do if you had multiple libraries and a program referencing these libraries, so there is no need to do this on the command line.
csc /target:library /out:ClassLibrary1.dll ClassLibrary1.cs
vbc /target:library /out:ClassLibrary2.dll ClassLibrary2.vb
vbc /target:winexe /out:Program.exe
   /reference:ClassLibrary1.dll,ClassLibrary2.dll Program.vb
This will produce a normal .exe that requires the two DLLs in the program directory or in the global assembly cache to run.
Now you can link these parts to a single self-contained EXE, using ILMerge:
ilmerge /target:winexe /out:SelfContainedProgram.exe
       Program.exe ClassLibrary1.dll ClassLibrary2.dll
The nice thing about this is that you can also merge third party assemblies like commercial class libraries into your program. And you do not have to modify your build process. All you have to do is to merge the assemblies to a single EXE before deploying.
Conclusion
I found ILMerge tremendously useful, and I think that something like this should be a part of the .NET framework SDK. Maybe just enhance al.exe so that it can also link DLLs.
I have only scratched the surface of the .NET build process and the capabilities of ILMerge, and this article might contain many inaccuracies or even errors. But I found ilmerge.exe so useful that I just had to write about it.
Resources
- ILMerge: The ILMerge utility from Michael Barnett of Microsoft Research.
- ILMerge Task: A NAnt task for ILMerge.
ILMerge
Brief Description
ILMerge is a utility for merging multiple .NET assemblies into a single .NET assembly. It works on executables and DLLs alike and comes with several options for controlling the processing and format of the output. See the accompanying documentation for details.
Download link: http://www.microsoft.com/downloads/en/details.aspx?FamilyID=22914587-b4ad-4eae-87cf-b14ae6a939b0&displaylang=en
Sunday, 20 February 2011
Detecting High Memory consuming functions in .NET code
NET Best Practice No: 1:- Detecting High Memory consuming functions in .NET code
Thanks a lot Mr. Peter Sollich
Do not user CLR on production and as a starting tool for performance evaluation
The sample application we will profile
Using CLR profiler to profile our sample
That was a tough way any easy way
Simplifying results using comments
As said before do not get carried away with execution time

Introduction and Goal
One of the important factors for performance degradation in .NET code is memory consumption. Many developers just concentrate on execution time to determine performance bottle necks in a .NET application. Only measuring execution time does not clearly give idea of where the performance issue resides. Ok, said and done one of the biggest task is to understand which function, assembly or class has consumed how much memory. In this tutorial we will see how we can find which functions consume how much memory. This article discusses the best practices involved using CLR profiler for studying memory allocation.
Please feel free to download my free 500 question and answer ebook which covers .NET , ASP.NET , SQL Server , WCF , WPF , WWF@ http://www.questpond.com .
Thanks a lot Mr. Peter Sollich
Let's start this article by first thanking Peter Sollich who is the CLR Performance Architect to write such a detail help on CLR profiler. When you install CLR profiler do not forget to read the detail help document written by Peter Sollich.
Thanks a lot sir, if ever you visit my article let me know your inputs.
CLR Profiler to rescue
CLR profiler is a tool which helps to detect how memory allocation happens in .NET code. CLR profiler tool is provided by Microsoft, you can download the same from
http://www.microsoft.com/downloads/details.aspx?familyid=A362781C-3870-43BE-8926-862B40AA0CD0&displaylang=en .
Note :- There are two version of CLR profiler one for .NET 1.1 and the other 2.0 framework. For 2.0 CLR profiler you can visit http://www.microsoft.com/downloads/details.aspx?familyid=A362781C-3870-43BE-8926-862B40AA0CD0&displaylang=en and to download 1.1 you can use http://www.microsoft.com/downloads/details.aspx?familyid=86ce6052-d7f4-4aeb-9b7a-94635beebdda&displaylang=en#Overview
Once you download CLR profiler you can unzip and run 'CLRProfiler.exe' from the bin folder.
If you have downloaded 2.0 CLR profiler it provides executables for 'X86' and 'X64' environment. So please ensure to run the appropriate versions.
Features of CLR profiler
CLR profiler is the best tool when it comes to understanding how memory allocations are done in .NET application code. It does two prime importance functions:-
. Gives a complete report of how memory is allocated in a .NET application. So you can see full report how memory is allocated as per data types, functions, methods etc.
. It also provides how much time the method was called.

Do not user CLR on production and as a starting tool for performance evaluation
CLR is an intrusive tool. In other words it runs its own logic of dumping memory values for every function / class / modules inside the application. In other words it interferes with the application logic. Let' say you have a normal application which calls function 1 and function 2. When you profile your application with CLR profiler it injects dumping of memory heap data after every function call as shown below.

In other words do not use CLR profiler to find execution time of your application. It actually slows down your application 10 to 100 times. You will end up with wrong results.
As said because it's an intrusion tool you should never use the same in production environment.
First thing you should never first start analyzing your performance issues by CLR profiler tool. It's more of a second step activity where you have zeroed on a function or a class which is having memory issues. So probably you can use performance counters to first find which methods and functions take long execution time and then use CLR profiler to see how the memory allocations are done.
How can we run CLR profiler?
One you have downloaded the CLR profiler from Microsoft site, unzip the files in a folder. Go to the unzipped folder in Binaries ? choose your processor and run 'CLRProfiler.exe'. You will be shown the CLR profiler as shown in the below figure.
The first step we need to decide what do we want to profile. There are two things one is the memory allocation and the other is number of calls to a method. So select what data you want to profile and then click start application.

Once you are done you can see the complete summary of profiling as shown below. It's a very complicated report we will see a simplistic approach when we profile the sample application.

Issues faced by CLR profiler
Some issues we faced while running CLR profiler. If you are getting the below screen and it does not stop, there can be two reasons:-
. You have .NET 2.0 and you are running CLR profiler 1.1.
. You have not registered ProfilerOBJ.dll in GAC.

The sample application we will profile
The application which we will profile is pretty simple. It has a simple button which calls two functions 'UseSimpleStrings' and 'UseStringBuilders'. Both these functions concatenate strings. One uses '+' for concatenations while the other uses the 'StringBuilder' class. We will be 1000 times concatenating the strings.
private void UsingSimpleStrings()
{
string strSimpleStrings="";
for (int i = 0; i < strsimplestrings =" strSimpleStrings">
The function which uses 'StringBuilder' class to do concatenation.
private void UsingStringBuilders()
{

StringBuilder strBuilder = new StringBuilder();
for (int i = 0; i <>
Both these functions are called through a button click.
private void btnDoProfiling_Click(object sender, EventArgs e)
{
UsingSimpleStrings();
UsingStringBuilders();

}

Using CLR profiler to profile our sample
Now that we know our application we will try to use profiler to see which function uses how much memory. So click on start application ? browse to the application exe and click on check memory allocation button and close the application. You will be popped up with a complete summary dialog box.
If you click on histogram button you can see memory allocations as per data type. I understand it's very confusing. So leave this currently.

If you are interested to see how much memory is allocated as per functions you can click on 'Allocation Graph'. This gives as per every function how much memory is consumed. Even this report is very confusing because so many function, so many methods and we are not able to locate our two functions of string 'UsingStringBuilders' and 'UsingSimpleStrings'.

To simplify the above graph right click and you will be popped with lot of filtering options. Let's use the 'Find Routine' search to filter unnecessary data. We have entered to get the button click event. From this button click those two functions are called.

The search now zooms on the method as shown in the below figure. Now double click on the 'btnDoProfiling_Click' box as highlighted in the below figure.

After double click you will see the below details. It's now better. But where did the second function go off. It's only showing 'UseSimpleStrings' function. This is because the report is coarse. So click on everything and you should see all the functions.

You can now see the other function also. What's the 26 bytes ?. It's just an extra string manipulation needed to when the functions are called, so we can excuse it. Let's concentrate on our two functions 'UseSimpleStrings' and 'UseStringBuilders' can now be seen. You can see string concatenation takes 3.8 MB while string builder object consumes only 16 KB. So string builder object is consuming less memory than simple string concatenation.

That was a tough way any easy way
The above shown way was really tough. Let's say you have 1000 of functions and you want to analyze which function consumes what memory. It's practically just not possible to go through every call graph, do a find and get your functions.
The best way is to export a detail report in to excel and then analyze the data. So click on view ? call tree.

Once you click on call tree you will be shown something as shown below. Click on view ?All functions ? you will be shown all functions ? click on file and save it as CSV.

Once you have exported the complete data to CSV, you can easily locate your methods and functions and see how much data has been allocated.

Simplifying results using comments
In case you know which methods to profile and you can enable the profiler at that moment when the method is called. In other words we can enable the CLR profiler from the application.
In order to enable the profiler from the C# code we need to first reference 'CLRProfilerControl.dll'. You can get this DLL from the same folder where we have the profiler exe.
You can then directly call the profiler control from your code as shown in the below code snippet. We have enabled the profiler before we call both the string manipulation functions. Once the function calls are done we have disabled the profiler.
private void btnDoProfiling_Click(object sender, EventArgs e)
{
CLRProfilerControl.LogWriteLine("Entering loop");
CLRProfilerControl.AllocationLoggingActive = true;
CLRProfilerControl.CallLoggingActive = true;

UsingSimpleStrings();
UsingStringBuilders();

CLRProfilerControl.AllocationLoggingActive = false;
CLRProfilerControl.CallLoggingActive = false;
CLRProfilerControl.LogWriteLine("Exiting loop");
CLRProfilerControl.DumpHeap();
}
So now let's run the CLR profiler and start our application. Please ensure that you disable the profile active check box because we are going to enable profiling from the code itself.

Now if you see the histogram you will see limited data. You can see it has only recorded memory allocation consumed from 'System.String' and 'System.Text.StringBuilder' data type.

If you see the allocation graph you can see it's pretty neat now. The cluttered view has completely gone off and we have pretty simple and focused view. Please note to click 'Everything' to see the remaining functions.

As said before do not get carried away with execution time
On the summary page you can see the comments button. If you click on the comments button it shows start time and end time. Do not get carried away with the time recorded. As we have previously cleared that it's an intrusive tool the results are not proper.

Entering loop (1.987 secs)
Exiting loop (2.022 secs)
Conclusion
. CLR profiler can be used to find memory allocated to functions, classes and assemblies to evaluate performance.
. It should not be used on production.
. It should not be used as a starting point for performance evaluation. We can first run perf counter, get the method having high execution time and then use CLR profiler to see the actual cause.
. You can use histogram to see memory allocation and call graph to see method wise memory allocation.
. If you know which methods you want to profile you can enable profiler from the application itself.
Concluding everything in to one basket as a best practice when you want to see memory allocation nothing can beat CLR profiler.
Source code
You can find the sample source code for profiling from bottom of this article.
Download questpond_633859417631850802_StringApplication.zip
Download CLR Profiler here http://www.microsoft.com/downloads/en/confirmation.aspx?familyid=86ce6052-d7f4-4aeb-9b7a-94635beebdda&displaylang=en
Memory Leak Detection in .NET
Introduction
Usually, it is very cumbersome to detect and locate memory leaks. This article will provide a way to locate memory leaks in .NET applications. First, I will talk about Resource Allocation and Garbage Collection algorithms, and then will talk about detecting leaks in .NET apps. Pay attention to the bold texts in the code section.
Background
Resource Allocation
The CLR (Common Language Runtime) allocates all the resources on the managed heap and releases them when they are no longer required by the application. C/C++ applications were prone to memory leaks because programmers had to manually allocate and free memory.
The Runtime maintains a NextObjPtr for the next free space on the heap. When a new process is initialized, the CLR allocates a contiguous space on the heap for this process represented by NextObjPtr, and increments the NextObjPtr pointer to the next free space. The space is contiguous, and is different from the C++ heap where it is maintained as a linked list. GC heap is efficient when compared to the C++ heap because to allocate new memory, the GC doesn't have to search from a list of free memory or through a linked list. As times pass by, gaps start to appear in the heap as objects get deleted, and so GC has to compact the heap, which is costly. GC in .NET uses the Win32 API VirtualAlloc or VirtualAllocEX to reserve memory.
.NET uses several types of memory like stack, unmanaged heap, and managed heap.
- Stack: It is managed on a per thread basis, and is used to store local variables, method parameters, and temporary values. GC doesn't clean the stack as its get automatically cleaned when the method returns. The references to objects are stored on the stack, but the actual object gets allocated on the heap and the GC is aware of that. When the GC cannot find a reference for an object, it removes it from the heap.
- Unmanaged Heap: Unmanaged code will allocate objects on the unmanaged heap or stack. Managed code can also allocate object on the unmanaged heap by calling Win32 APIs.
- Managed Heap: Managed code allocates objects on the managed heap, and the GC takes care of the management of the managed heap. The GC also maintains a Large Object Heap to compensate the cost of moving large objects in memory.
Garbage Collection Algorithm
The garbage collector checks the heap for objects which are no longer used by the application. If such objects exist, then the GC removes those objects from the heap. Now, the question is how GC finds out about these objects which are not used by the application. Every application maintains a set of roots. Roots are like pointers to the objects on the heap. All global and static object pointers are considered as application roots. Any local variable on the thread stack is considered as application root. This list of roots is maintained by the JIT compiler and the CLR, and is made available to the GC.
When the GC starts running, it treats all objects as garbage, and makes an assumption that none of the objects on the heap are accessible. It then starts walking with the list of application roots, and starts building a graph of accessible objects. It marks all the objects on the heap as accessible if the objects are directly accessible lie an application root or indirectly accessible via any other object. For each application, the GC maintains a tree of references that tracks the objects referenced by the application. Using this approach, GC builds a list of live objects, and then walks through the heap in search of objects which are not present in this list of live objects. After finding out the objects which are not present in this list of live objects, it marks them all as garbage, and starts to compact the memory to remove holes which were created by unreferenced (dead) objects. It uses the memcpy function to move the objects from one memory location to another, and modifies the application roots to point to new locations.
If there is a live reference to the object, then it is said to be strongly rooted. .NET also has the concept of Weak Reference. Any object can be created as a weak reference which tells the GC that we want to access this object, but if the GC is going through garbage collection, then it can collect it. Weak reference is generally used for very large objects which are easy to create but are costly to maintain in memory.
Moving objects in memory gives a significant performance hit. To improve performance, the GC does several optimizations like large object heap and generations. Objects which are in size greater than 85,000 bytes are allocated on the large object heap. Moving large objects in memory is costly, so the GC maintains a separate heap for large objects, which it never compacts. The GC also maintains generations of objects. Whenever a new object is to be allocated and the managed heap doesn't have enough memory for the new object, a GC collection is performed. For the first time, every object in the heap is considered in Gen 0. After that, the GC performs a collection. The objects which survive are moved to Gen 1, and similarly, those which survive the Gen 1 collection move to Gen 2. The GC makes the assumption that a new object will have a short lifetime and an old object will have a longer lifetime. Whenever new memory is required, the GC tries to collect memory from Gen 0, and if enough memory can't be obtained from Gen 0 collections, then a Gen 1 or even Gen 2 collection is performed.
GC Sequence
The following steps occur during each GC collection:
- Execution Engine Suspension – The EE is suspended until all managed threads have reached a point in their code execution deemed "safe".
- Mark – Objects that don't have roots are marked garbage.
- Plan – The GC creates a budget for each generation being collected, and then determines the amount of fragmentation that will exist in the managed heap as a result of a GC collection.
- Sweep – Deletes all objects marked for deletion.
- Compact – Moves all non-pinned objects that survived the GC to the lower end of the heap.
- Execution Engine Restart – Restart the execution of managed threads.
Roots in GC
There are different kinds of roots in the GC:
- Strong Reference – If a strong reference exists for an object, then it is considered in use and is not collected during the next GC collection.
- Weak Reference – This is also a reference, but the object can live till the next GC collection. Weak Reference works like a cache for an object.
Finalization
The GC can track an unmanaged resource's lifetime, but it can't reclaim the memory used by the resource unless destructors are used or code is written to override the Finalize in the base class.
A finalizer exists to allow the programmer to clean up the native resources used by the object before the object is garbage collected. But, using a finalizer promotes the object collection to the next generation. Whenever a new object with a Finalize method is allocated on the heap, a pointer to that object is placed on the Finalization queue. During garbage collection, if the GC finds that an object is not reachable, it then searches the Finalization queue for any reference to the object. If it finds a reference, then it removes the object from the Finalization queue and appends it to other data structure called a Freachable queue. At this point, the Garbage Collector has finished identifying garbage and compacts the memory. After that, the finalization thread empties the Freachable queue by executing each object's Finalize method. The next time a GC collection is performed, the GC sees this object as garbage and reclaims the memory assigned to this object.
It takes more time to reclaim the memory from objects having Finalize methods and affects performance, so a Finalize method should only be used when required.
Detecting Memory Leaks
Memory leaks can occur either in the stack, unmanaged heap, or the managed heap. There are many ways to find out that memory is leaking, like memory increasing in the Task Manager. Before starting to correct the memory problem, you need to determine the kind of memory which is leaking. Perfmon can be used to examine counters such as Process/Private bytes, .NET CLR Memory/# bytes in all heaps, and the .NET CLR LocksAndThreads/# of the current logical thread. If the .NET CLR LocksAndThreads/# is increasing unexpectedly, then the thread stack is leaking. If only Process/Private bytes are increasing but the .NET CLR Memory is not increasing, then unmanaged memory is leaking, else if both are increasing, then managed memory is leaking.
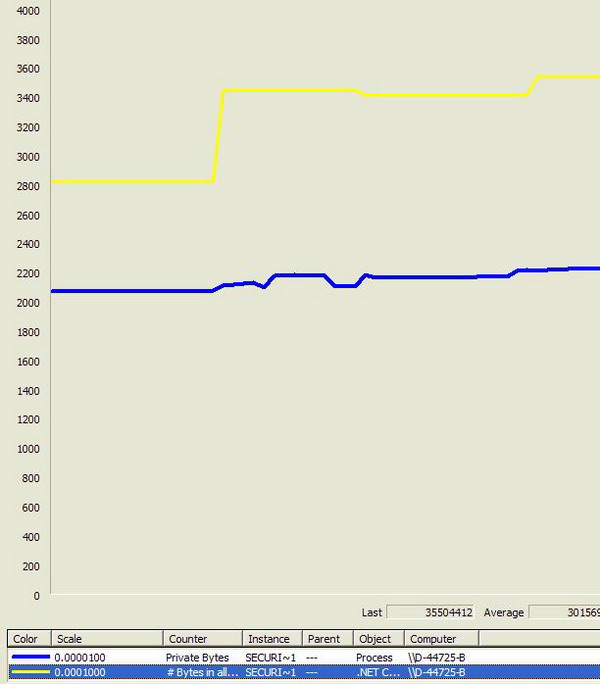
Figure 1 : Perfmon output for Privates Bytes and #Bytes in all heaps
Stack Memory
Stack memory gets reclaimed after the method returns. Stack memory can get leaked in two ways. First, a method call consumes a significant amount of stack resources that never returns, thereby never releasing the associated stack frame. The other is by creating background threads and never terminating them, thus leaking the thread stack.
Unmanaged Heap Memory
If the total memory usage is increasing but the .NET CLR memory is not increasing, then unmanaged memory is leaking. Unmanaged memory can leak in several ways - if the managed code is interoperating with unmanaged code and a leak exists in the unmanaged code. .NET doesn't make any guarantee that the finalizer for each object will get called. In the current implementation, .NET has one finalizer thread. If there exists a finalizer which blocks this thread, then the other finalizer will never get called and the unmanaged memory will leak which was supposed to be released. When an AppDomain is torn down, the CLR tries to run all the finalizers, but if a blocking finalizer exists, then it can prevent the CLR from completing the AppDomain tear down. To prevent this, the CLR implements a timeout on the process, after which it stops the finalization process, and the unmanaged memory which was supposed to be removed is left leaked.
Managed Heap Memory
Managed memory can also get leaked by several ways like fragmentation of the Large Object Heap. The memory in the Large Object Heap never gets compacted, so there is a loss in memory over there. Also, if there exist some objects which are not needed, but there exists a reference to the objects, then GC never claims the memory assigned to these objects.
This kind of leak is common, and can be resolved using SOS.dll. There are two ways to use SOS.dll:
- WinDbg tool: This tool can be downloaded from Microsoft.
Run the application which you want to debug for memory problems. Start the WinDbg tool and attach it to the application process.
OR
- Open the application in Visual Studio 2005. Go to the properties of the project. In the Debug tab, make sure you have "Enable unmanaged code debugging" checked, or if you are attaching to a process, then in the "Attach to Process" window, click Select, and then select "Managed code" and "Native code". Run the application, and set a breakpoint in the code somewhere you want your application to break. Hit the breakpoint. Go to Debug -> Windows -> Immediate.
- Run .load SOS.dll
The SOS.dll is the most popular debugging extension used to debug managed code. It has many powerful commands that can obtain information such as managed call stack, details about managed heap, objects in heap, and much more.
- Run !dumpheap –stat or !dumpheap –type PolicyEditor
This command scans the GC heaps and lists the objects that lie therein. The –Stat argument is used to display the output to a statistical summary. More information about this (any) command can be found by using !help dumpheap.
The output will be like:
03f354ec       20         1120 View.Console.Configuration.Workspace
03713e44       35         1120 System.Windows.Forms.LayoutEventHandler
03710bec       56         1120 System.ComponentModel.Container+Site
024dc014       70         1120 System.Configuration.PropertySourceInfo
0492ed48       94         1128 Infragistics.Shared.SubObjectBase+NotifyId
081d9ac4        2         1136 View.Manger.UI.PolicyEditor
03d79898        1         1140 System.Text.RegularExpressions.RegexCharClass+
                              LowerCaseMapping[]
08857bdc       22         1144 Infragistics.Win.UltraWinToolbars.ComboBoxTool+
                              ComboBoxToolExtraSharedProps
0869c604 8 1152 Infragistics.Win.UltraWinEditors.UltraTextEditorUIElement - The above command will list all the objects present in the memory. If you think that an object should not be present in memory and should have been garbage collected, then open a Find (Ctrl +F) window and type the name of the object and search for it. If you cannot find the object, then either it has been garbage collected, or it was not instantiated. If you find the object, for example, the
PolicyEditorobject in the above list, then copy the MT (Method Table) address, which is 081d9ac4 in the above case. - Run !dumpheap -mt 081d9ac4
This will list all the objects with this MethodTable address. Those objects are the instances of
PolicyEditor.The output will be something like:
 ------------------------------
Heap 0
Address       MT     Size
total 0 objects
------------------------------
Heap 1
Address       MT     Size
total 0 objects
------------------------------
Heap 2
Address       MT     Size
28404fd8 081d9ac4      568
total 1 objects
------------------------------
Heap 3
Address       MT     Size
2c49f098 081d9ac4      568
total 1 objects
------------------------------
total 2 objects
Statistics:
     MT    Count    TotalSize Class Name
081d9ac4        2         1136 View.Manger.UI.PolicyEditor
Total 2 objects - Run !gcroot 28404fd8
This will list the path to this object from the root of the GC tree. If some path exists for this object, then this is considered non garbage and is not collected by the GC, which could be a reason for memory leakage.
The output will be like:
Copy the address of any instance, for example, 28404fd8.
Error during command: warning!
Extension is using a feature which Visual does not implement.
Scan Thread 6460 OSTHread 193c
Scan Thread 1884 OSTHread 75c
Scan Thread 7520 OSTHread 1d60
Scan Thread 7716 OSTHread 1e24
Scan Thread 0 OSTHread 0
Scan Thread 7428 OSTHread 1d04
Scan Thread 0 OSTHread 0
Scan Thread 4728 OSTHread 1278

DOMAIN(01D637C8):HANDLE(Pinned):22b148c:Root:302d9250(System.Object[])->
2908633c(System.EventHandler)->
29085f2c(System.Object[])->
2c53a4cc(System.EventHandler)->
2c53a340(Infragistics.Win.UltraWinStatusBar.UltraStatusBar)->
2c5513b0(System.Collections.Hashtable)->
2c5513e8(System.Collections.Hashtable+bucket[])->
2c5390ac(Infragistics.Win.Printing.UltraPrintPreviewControl)->
2c530668(Infragistics.Win.UltraWinGrid.UltraGridPrintDocument)->
2c530858(System.Drawing.Printing.PrintEventHandler)->
2c52eff0(View.Windows.InfragisticsControls.CommonUltraGrid)->
24487ed0(System.EventHandler)->
2c52df64(View.Manger.UI.PolicyClarificationBrowser)->
2448f478(System.EventHandler)->
2c4e3714(View.Manger.UI.PolicyEditor)

DOMAIN(01D637C8):HANDLE(Pinned):22c12f8:Root:302d52b8(System.Object[])->
282e427c(System.Collections.Generic.Dictionary`2[[System.Object, mscorlib],
    [System.Collections.Generic.List`1
    [[Microsoft.Win32.SystemEvents+SystemEventInvokeInfo, System]],
    mscorlib]])->
282e4444(System.Collections.Generic.Dictionary`2+Entry[[System.Object, mscorlib],
    [System.Collections.Generic.List`1
    [[Microsoft.Win32.SystemEvents+SystemEventInvokeInfo, System]],
    mscorlib]][])->
282ee76c(System.Collections.Generic.List`1
    [[Microsoft.Win32.SystemEvents+SystemEventInvokeInfo, System]])->
2048e9c4(System.Object[])->
2c500534(Microsoft.Win32.SystemEvents+SystemEventInvokeInfo)->
2c500514(Microsoft.Win32.UserPreferenceChangedEventHandler)->
2c4fff54(Infragistics.Win.UltraWinStatusBar.UltraStatusBar)->
2446c824(System.Collections.Hashtable)->
2446c85c(System.Collections.Hashtable+bucket[])->
2c4fecc0(Infragistics.Win.Printing.UltraPrintPreviewControl)->
2c4f6a24(Infragistics.Win.UltraWinGrid.UltraGridPrintDocument)->
2c4f6c14(System.Drawing.Printing.PrintEventHandler)->
2c4f53ac(View.Windows.InfragisticsControls.CommonUltraGrid)->
2446e90c(System.EventHandler)->
24450e80(View.Manger.UI.EvidenceDefinitionMiniBrowser)->
2c4e34bc(View.Manger.Views.PolicyEditController)->
2c4e3524(View.Manger.Views.PolicyEdit)->
2449cfe0(System.Windows.Forms.LayoutEventArgs)->
2c4e3714(View.Manger.UI.PolicyEditor)

DOMAIN(01D637C8):HANDLE(WeakLn):22c1d88:Root:24496d2c(
                System.Windows.Forms.NativeMethods+WndProc)->
2c4e39fc(System.Windows.Forms.Control+ControlNativeWindow)->
2c4e3714(View.Manger.UI.PolicyEditor)
DOMAIN(01D637C8):HANDLE(WeakSh):22e313c:Root:2c4e39fc(
System.Windows.Forms.Control+ControlNativeWindow) - In the above output, we can see that the
PolicyClarificationBrowserobject has an event handler which holds a reference toPolicyEditor. To find out who is hooking up this event, take the address of the event handler, which is 2448f478, and dump this object. - !dumpobj 2448f478
Name: System.EventHandler
MethodTable: 7910d61c
EEClass: 790c3a7c
Size: 32(0x20) bytes
(C:\WINDOWS\assembly\GAC_32\mscorlib\2.0.0.0__b77a5c561934e089\mscorlib.dll)
Fields:
     MT    Field   Offset                 Type VT     Attr    Value Name
790f9c18  40000f9        4        System.Object  0 instance 2c4e3714 _target
79109208  40000fa        8 ...ection.MethodBase  0 instance 00000000 _methodBase
790fe160  40000fb        c        System.IntPtr  0 instance 140144060 _methodPtr
790fe160  40000fc       10        System.IntPtr  0 instance        0 _methodPtrAux
790f9c18  4000106       14        System.Object  0 instance 00000000 _invocationList
790fe160 4000107 18 System.IntPtr 0 instance 0 _invocationCount - If you take the address of the target in the above output, which is 2c4e3714, and run a !dumpobj with this address, then you can see in the output that it is of type
PolicyEditor. To get the method that is hooked up as a handler, convert the int value in_methodPtrto hex.?0n140144060
(This command will not work in the Immediate Window. To run this command, you need to attach WinDbg to this or any other managed process, or use Google to do that.)
The output will be:
Evaluate expression: 140144060 = 085a6dbc
And then run !ip2md 085a6dbc
Failed to request MethodData, not in JIT code range - !dumpobj 2c4e3714
The output will be:
Sometimes this works, and will give you the name of the method, but if doesn't work, then we can dump the object and then find out the method.
Name: View.Manger.UI.PolicyEditor
MethodTable: 0820865c
EEClass: 08219fd8
Size: 568(0x238) bytes
(C:\Documents and Settings\testuser\Application Data\View\SMC-D-44725-B\View.Manger.UI.dll)
Fields:
     MT    Field   Offset                 Type VT     Attr    Value Name
790f9c18  4000184        4        System.Object  0 instance 00000000 __identity
024c1798  40008bc        8 ...ponentModel.ISite  0 instance 00000000 site
036f9c3c  40008bd        c ....EventHandlerList  0 instance 2448f8ac events
790f9c18 40008bb 108 System.Object 0 static 242e1afc EventDisposed - !dumpmt -md 0820865c
The output will be:
EEClass: 08219fd8
Module: 036e48d8
Name: View.Manger.UI.PolicyEditor
mdToken: 02000069  (C:\Documents and Settings\testuser\Application Data\
                   View\SMC-D-44725-B\View.Manger.UI.dll)
BaseSize: 0x238
ComponentSize: 0x0
Number of IFaces in IFaceMap: 15
Slots in VTable: 430
--------------------------------------
MethodDesc Table
  Entry MethodDesc      JIT Name
022a9fc5   022a9ec8     NONE System.ComponentModel.Component.ToString()
793539c0   7913bd50   PreJIT System.Object.Equals(System.Object)
…
…
085a6d44   08208578     NONE View.Manger.UI.PolicyEditor.btnStatementDelete_Click(
                            System.Object, System.EventArgs)
085a6de4   08208580     NONE View.Manger.UI.PolicyEditor.btnProperties_Click(
                            System.Object, System.EventArgs)
085a6dbc   08208588     NONE View.Manger.UI.PolicyEditor.ClarificationBrowser_OpenClick(
                            System.Object, System.EventArgs)
08208f0d   08208590     NONE View.Manger.UI.PolicyEditor.OpenClarification()
085a6dd0   08208598     NONE View.Manger.UI.PolicyEditor.Clarification_SelectionChanged(
                            System.Object, View.Manger.UI.SelectEventArgs)
085a6d94   082085a0     NONE View.Manger.UI.PolicyEditor.btnExceptionNew_Click(
                            System.Object, System.EventArgs)

…
…
In the above output, search for the hex address we calculated above from _methodptr, and you will get the name of the method which is still holding a reference to the PolicyEditor object and is the reason for the memory leak.
Detecting .NET application memory leaks
Introduction
Memory leaks in .NET application have always being programmer's nightmare. Memory leaks are biggest problems when it comes to production servers. Productions servers normally need to run with least down time. Memory leaks grow slowly and after sometime they bring down the server by consuming huge chunks of memory. Maximum time people reboot the system, make it work temporarily and send a sorry note to the customer for the downtime.
Please feel free to download my free 500 question and answer eBook which covers .NET , ASP.NET , SQL Server , WCF , WPF , WWF@ http://www.questpond.com .

Avoid task manager to detect memory leak
The first and foremost task is to confirm that there is memory leak. Many developers use windows task manager to confirm, is there a memory leak in the application?. Using task manager is not only misleading but it also does not give much information about where the memory leak is.

First let's try to understand how the task manager memory information is misleading. Task manager shows working set memory and not the actual memory used, ok so what does that mean. This memory is the allocated memory and not the used memory. Adding further some memory from the working set can be shared by other processes / application.

So the working set memory can big in amount than actual memory used.
Using private bytes performance counters to detect memory leak
In order to get right amount of memory consumed by the application we need to track the private bytes consumed by the application. Private bytes are those memory areas which are not shared by other application. In order to detect private bytes consumed by an application we need to use performance counters.
Below are the steps we need to follow to track private bytes in an application using performance counters:-
- Start you application which has memory leak and keep it running.
- Click start à Goto run and type 'perfmon'.
- Delete all the current performance counters by selecting the counter and deleting the same by hitting the delete button.
- Right click à select 'Add counters' à select 'process' from performance object.
- From the counter list select 'Private bytes'.
- From the instance list select the application which you want to test memory leak for.
If you application shows a steady increase in private bytes value that means we have a memory leak issue here. You can see in the below figure how private bytes value is increasing steadily thus confirming that application has memory leak.

The above graph shows a linear increase but in live implementation it can take hours to show the uptrend sign. In order to check memory leak you need to run the performance counter for hours or probably days together on production server to check if really there is a memory leak.
3 step process to investigate memory leak
Once we have confirmed that there is a memory leak, it's time to investigate the root problem of the memory leak. We will divide our journey to the solution in 3 phases what, how and where.
- What: - We will first try to investigate what is the type of memory leak, is it a managed memory leak or an unmanaged memory leak.
- How: - What is really causing the memory leak. Is it the connection object, some kind of file who handle is not closed etc?
- Where: - Which function / routine or logic is causing the memory leak.

What is the type of memory leak? Total Memory = Managed memory + unmanaged memory
Before we try to understand what the type of leak is, let's try to understand how memory is allocated in .Net applications. .NET application have two types of memory managed memory and unmanaged memory. Managed memory is controlled by garbage collection while unmanaged memory is outside of garbage collectors boundary.

So the first thing we need to ensure what is the type of memory leak is it managed leak or unmanaged leak. In order to detect if it's a managed leak or unmanaged leak we need to measure two performance counters.
The first one is the private bytes counter for the application which we have already seen in the previous session.
The second counter which we need to add is 'Bytes in all heaps'. So select '.NET CLR memory' in the performance object, from the counter list select 'Bytes in all heaps' and the select the application which has the memory leak.

Private bytes are the total memory consumed by the application. Bytes in all heaps are the memory consumed by the managed code. So the equation becomes something as shown in the below figure.

Un Managed memory + Bytes in all helps = private bytes, so if we want to find out unmanaged memory we can always subtract the bytes in all heaps from the private bytes.
Now we will make two statements:-
- If the private bytes increase and bytes in all heaps remain constant that means it's an unmanaged memory leak.
- If the bytes in all heaps increase linearly that means it's a managed memory leak.
Below is a typical screenshot of unmanaged leak. You can see private bytes are increasing while bytes in heaps remain constant

Below is a typical screen shot of a managed leak. Bytes in all heaps are increasing.

How is the memory leak happening?
Now that we have answered what type of memory is leaking it's time to see how is the memory leaking. In other words who is causing the memory leak ?.
So let's inject an unmanaged memory leak by calling 'Marshal.AllocHGlobal' function. This function allocates unmanaged memory and thus injecting unmanaged memory leak in the application. This command is run within the timer number of times to cause huge unmanaged leak.
private void timerUnManaged_Tick(object sender, EventArgs e)
{
 Marshal.AllocHGlobal(7000);
}
It's very difficult to inject a managed leak as GC ensures that the memory is reclaimed. In order to keep things simple we simulate a managed memory leak by creating lot of brush objects and adding them to a list which is a class level variable. It's a simulation and not a managed leak. Once the application is closed this memory will be reclaimed.
private void timerManaged_Tick(object sender, EventArgs e)
 {
           for (int i = 0; i < 10000; i++)
           {
               Brush obj = new SolidBrush(Color.Blue);
               objBrushes.Add(obj);
           }
       }
In case you are interested to know how leaks can happen in managed memory you can refer to weak handler for more information http://msdn.microsoft.com/en-us/library/aa970850.aspx .
The next step is to download 'debugdiag' tool from http://www.microsoft.com/DOWNLOADS/details.aspx?FamilyID=28bd5941-c458-46f1-b24d-f60151d875a3&displaylang=en
Start the debug diagnostic tool and select 'Memory and handle leak' and click next.

Select the process in which you want to detect memory leak.

Finally select 'Activate the rule now'.

Now let the application run and 'Debugdiag' tool will run at the backend monitoring memory issues.

Once done click on start analysis and let the tool the analysis.

You should get a detail HTML report which shows how unmanaged memory was allocated. In our code we had allocated huge unmanaged memory using 'AllochGlobal' which is shown in the report below.
| Type | Description |
| Warning | mscorlib.ni.dll is responsible for 3.59 MBytes worth of outstanding allocations. The following are the top 2 memory consuming functions: |
| Warning | ntdll.dll is responsible for 270.95 KBytes worth of outstanding allocations. The following are the top 2 memory consuming functions: |
Managed memory leak of brushes are shown using 'GdiPlus.dll' in the below HTML report.
| Type | Description |
| Warning | GdiPlus.dll is responsible for 399.54 KBytes worth of outstanding allocations. |
Where is the memory leak?
Once you know the source of memory leak is, it's time to find out which logic is causing the memory leak. There is no automated tool to detect logic which caused memory leaks. You need to manually go in your code and take the pointers provided by 'debugdiag' to conclude in which places the issues are.
For instance from the report it's clear that 'AllocHGlobal' is causing the unmanaged leak while one of the objects of GDI is causing the managed leak. Using these details we need to them go in the code to see where exactly the issue lies.
Source code
You can download the source code from the bottom of this article which can help you inject memory leak.
Thanks, Thanks and Thanks
It would be unfair on my part to say that the above article is completely my knowledge. Thanks for all the lovely people down who have written articles so that one day someone like me can be benefit.
- http://blogs.msdn.com/tess/ A great blog by a lovely lady Tess on debuggers. There are some great labs on memory leak detection using windbg , do not miss it. Tess god bless you, your blog rocks like anything.
- http://msdn.microsoft.com/en-us/magazine/cc163491.aspx This is a great article by James kovacs on managed and unmanaged memory leaks, must to read.
- http://davybrion.com/blog/2009/08/finding-memory-leaks-in-silverlight-with-windbg/ Great article on finding memory leaks using windbg.
- http://www.itwriting.com/dotnetmem.php :- Great link which explains in detail the difference between working set memory and private bytes.
- http://www.microsoft.com/DOWNLOADS/details.aspx?FamilyID=28bd5941-c458-46f1-b24d-f60151d875a3&displaylang=en Download for the debugdiag tool.
- http://blogs.msdn.com/davidklinems/archive/2005/11/16/493580.aspx David Kline explains the 3 common causes of memory leak in managed application.
My other .NET best practices article
.NET best practice 1:- In this article we discuss about how we can find high memory consumption areas in .NET. You can read about the same at http://www.dotnetspark.com/kb/772-net-best-practice-no-1--detecting-high-memory.aspx
.NET best practice 2:- In this article we discuss how we can improve performance using finalize / dispose pattern. http://www.dotnetspark.com/kb/814-net-best-practice-no-2--improve-garbage.aspx
.NET best practice 3:- How can we use performance counters to gather performance data from .NET applications http://www.dotnetspark.com/kb/815-net-best-practice-no-3--using-performance.aspx
.NET best practice 4 :- How can we improve bandwidth performance using IIS compression http://www.dotnetspark.com/kb/846-best-practice-no-4--improve-bandwidth-performance.aspx.
Subscribe to:
Posts (Atom)